
Findings
Data Summary
No Data Found
No Data Found
Figure: Cumulative summary of all responses across all counties.
A large proportion of responses fall in the later stages of the model. However, a push is necessary to add more responses to the growing and later stages and out of the seedling stage of data maturity.
While the data quality and availability assessment will provide an indication of the robustness of data, it does not explain potential reasons for why this is the case and what should be done. The objective is to ascertain intentionality, ensure sustainability and scalability in strengthening the data ecosystem at the county government level for the particular theme.
According to the respondents, a trend can be seen that data quality generally mimics the institutional enablers that ensure that it continues to be produced and used. In other words, it can be seen that respondents felt there was least growth (or ‘growing’ stage) for both quality and causality enablers.
And even though there are a large number of respondents who cumulatively believe that quality data is both available and causality enablers present, that is, ‘flowering’ and ‘fruitful’; it is also seen that much still remains to be done as respondents also felt that data quality and causality enablers are at a ‘seedling’ stage.
Quality and availability
No Data Found
Figure: Overall Summary of responses on Data Quality and Availability.
The majority of responses fall within the flowering and fruitful stages, however the number of responses in the seedling stage is still high. This is especially true under data quality and availability where there are few and no responses in the growing stage, respectively.
It is apparent that counties are collecting and reporting data on a regular basis for the sectors under study. However, the largest percentage of data collection is done manually, from primary data sources, by field officials and others charged with providing public services (for example health workers or agriculture extension officers) via various government institutions or at ward level and compiled into digital reports at the sub county and then county headquarters. We posit that some sectors such as governance and health where there have been strong national implementation structures and centralised national-level databases for data management have relatively standardised methods for consistent data collection and reporting. This includes the Government Human Resource Information System (GHRIS)4, National Education Management Information System (NEMIS)5, Integrated Financial Management Information System (IFMIS)6 and the Kenya Health Information System (KHIS)7. The result is that some departments register strongly on ‘flowering’ and ‘fruitful’ stages due to institutionalisation of processes, people and even resources for continued sustenance and improvement of data management practices and use.
Incidentally, during public meetings and public participation, data is collected using physical attendance registers with information captured including the demographics of the citizens that were present and these are stored in physical files and then summarised in digital formats for reporting.
Our interviews revealed that data is mostly reported in quarterly and annual reports for accountability purposes and most of these are available to the public. Most departments received high scores when it comes to reporting on data as can be seen in Figure 3.
The agriculture and education (focused on Early Childhood and Development Education (ECDE) and Technical and Vocational Education and Training (TVET)) departments within counties are devolved functions according to the 4th schedule of the Constitution of Kenya (2010) and so the responsibility of data management naturally also mostly falls on the shoulders of the county governments.
Data is collected on site through manual registers. They have a variety of systems for data storage in place which includes manual systems (that is physical files) to spreadsheets (on PCs and/or Google sheets). This differs depending on the priorities of the departmental managers, data competencies and the county government. Overall, it was found to be more difficult to standardise data collection practises within the agricultural sector because agricultural activities vary in different counties. Respondents revealed that most of the quantitative data is estimated based on formulas since the field staff cannot visit and measure every farm.
Most of the data has been made available to the public mostly in the form of PDF documents on county government websites and the websites for other national government agencies such as DHIS and KNBS, which is not a document format that citizens can easily extract data from for further analysis. In most cases, members of the public can request this data from local government officials. However, most of the data is available in county progress reports, including the occasional CIPD reports and sectoral reports.
Causality
No Data Found
Figure: Overall Summary of responses on Causality.
Scores are highest under incentives & accountability, and coordination & governance. There is room for improvement in the areas of non-governmental ecosystem and mandate. The widest range of responses was observed under resourcing, but with an increasing number of responses in the later stages of maturity.
The study found that counties generally score highly on mandate, with most responses falling under the ‘fruitful’ stage of the model. This may be linked to the legal frameworks that are in place to ensure that counties collect data, including the statistics function that falls under the county planning and development role in the 4th schedule of the constitution of Kenya. The bill of rights also grants citizens the right to access information held by the state, and the state is required to publish and publicise important information in the same chapter.
The scores for incentives and accountability mostly fall within the last two stages of maturity. This may be due to the demand for accountability to the national treasury to receive funds. It can be attributed to the need by counties (and thereby departments) to comply with most of the reporting demands of the Office of Controller of Budget (OCOB). Disbursements to county governments are made by the National Treasury upon passage of an Appropriation Act, requisitions involving the Commission for Revenue Allocation (CARA), and upon approval by OCOB.
GOVERNANCE
SECTOR
- County budget – development and recurrent
- County annual reports
- Amount of ‘own’ revenue as a percentage of total budget
- Collection efficiency
- Total county employees per 1000 population, disaggregated by level of education (primary, secondary, university)
- No. of Services under E-Governance
- No. of town hall meetings held
- No of civic education events held in the County
- Annual number of public local government meetings and total attendance
- No. of policies and laws passed per year
- Does the county have an Ombudsman to address Citizen grievances
- Number of live broadcasts of House proceedings
Data Summary
No Data Found
No Data Found
Figure: Summary of Governance Sector Results.
The responses in the governance sector present an overall high level of maturity, with room for growth where both quality & availability and causality are concerned.
Results
Quality and availability
No Data Found
Figure 6: Data Quality and Availability Scores – Governance.
The scores are high across the board, with most responses falling in the latter stages of the model. However, there are more responses in the flowering stage than the final stage of maturity, and therefore room for further improvement.
The interviews and data show that budgeting and finance data is key for the governance sector, mostly for planning and accountability. All finance and procurement data must be logged in real time to IFMIS, which is also the e-procurement system used by both the national and country governments. Data is uploaded to the national database (IFMIS) in real time and hence they have efficient systems in place to manage collection and sharing of finance data. Details of procurement processes, payments and revenues are regularly logged on the digital platform. Additionally, most of the counties also possess Revenue Management Systems which are key in issuing business permits, tracking various payments made to the county by businesses. This includes mapping out where these actual businesses are and their contact details.
Traditional line-item budgets (including Kenya’s budget until 2013/14) previously focused on providing details on all the government was spending money on leading to voluminous data on specific inputs15. Post this period, there was a shift to program- based budgets (PBB) which organise the budget around objectives rather than inputs16. Data on/for public participation is key to drive this sector; PBB as driven through counties makes a distinction in earmarked development budgets to both flagship projects as well as an amount allocation to the ward level that must be spent on priorities identified by citizens through public participation. Data from public participation is essential for accountability processes and these exercises are well documented on paper at the time of the event.
The counties participating in this assessment have also instituted feedback mechanisms (similar to CAJ) and systems (for complaints, compliments) including suggestion boxes, online forms, access to local government officials at sub county headquarters, and town hall meetings. However, for most of the counties in this assessment, we found that the avenues for feedback are not anonymous as the views are collected at public events, offices or call centres and SMS systems which log personal contacts of reporters.
Causality
No Data Found
Figure: Causality scores – Governance.
This section has a high proportion of responses in the fruitful stage. There is a significant number of responses in the seedling stage, especially in the non-government ecosystem category.
Financial incentives and penalties are used to drive collection and reporting of this sectoral, but mostly budget related data. According to the Controller of Budget Act of 2016, the Controller of Budget shall, in accordance with Article 228 (6) of the Constitution, submit to Parliament quarterly budget implementation reports for the national and county governments within 30 days after the end of each quarter. The law further states that a public officer, State Organ or State office shall cooperate with the Controller of Budget to enable the Controller of Budget to carry out his or her functions. Those who refuse or fail to cooperate with the Controller of Budget as required by this section commits an offence and is liable, on conviction, to a term of imprisonment not exceeding two years or to a fine not exceeding one million shillings, or to both. At the time of writing, Members of Parliament have been pushing for harsher penalties for late fiscal reporting (a jail term of 5 years and/or fine of up to 10 million shillings).
County governments rely on legislation and infrastructure from the national government to support their data collection and right to information mandates. It should be noted however that the National Treasury has been faulted by Senators and the Council of Governors over perpetual late disbursement of cash to counties, a trend which the leaders say is slowing down the implementation of devolution.
All data on procurement, budget and revenue is recorded on the IFMIS platform in real time. Data collection outside of financial transactions and processes is mostly manual but transferred to digital platforms for reporting to the national government and in annual progress reports.
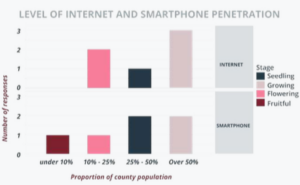 Infrastructure improvements underpinned by availability of cheap smartphones and digitization of crucial government services such as e-Citizen services, National Transport & Safety Authority’s Transport Information Management System (TIMS), Kenya Revenue Authority’s iTax, Huduma centres, among others, have increased the appetite/demand for internet access due to availing of these services online in recent years. According to the Communications Authority of Kenya (Sector Statistics Report for Quarter 1 of Financial year 2021/22), by 30th September 2021, the number of mobile phone devices accessing mobile networks stood at 59.0 million, out of which 33.0 million were feature phones and 26.0 million smartphones (the penetration levels of feature phones and smartphones stood at 67.9% and 53.4% respectively). Still, according to the Kenya Economic Update by the World Bank (2019), whereas 44% of the urban population have access to the internet and only 17% of people in rural areas have access.
In the counties of interest, it was found that people mostly relied on access to the internet through cyber cafes and at sub-county offices (as opposed to through their smartphones) when it comes to government e-services. Most people in the rural counties prefer basic handsets with batteries that last longer compared to smartphones with shorter battery lives; and since most simple phones do not connect to the Internet, the result is fewer people with Internet access.
Additionally, gender power dynamics are another obstacle to Internet access in rural areas -with many rural women not participating at the household level. And remote areas in some counties still do not have the appropriate infrastructure for all residents to have access to internet services – which might hamper any e-government initiatives that are planned.
Infrastructure improvements underpinned by availability of cheap smartphones and digitization of crucial government services such as e-Citizen services, National Transport & Safety Authority’s Transport Information Management System (TIMS), Kenya Revenue Authority’s iTax, Huduma centres, among others, have increased the appetite/demand for internet access due to availing of these services online in recent years. According to the Communications Authority of Kenya (Sector Statistics Report for Quarter 1 of Financial year 2021/22), by 30th September 2021, the number of mobile phone devices accessing mobile networks stood at 59.0 million, out of which 33.0 million were feature phones and 26.0 million smartphones (the penetration levels of feature phones and smartphones stood at 67.9% and 53.4% respectively). Still, according to the Kenya Economic Update by the World Bank (2019), whereas 44% of the urban population have access to the internet and only 17% of people in rural areas have access.
In the counties of interest, it was found that people mostly relied on access to the internet through cyber cafes and at sub-county offices (as opposed to through their smartphones) when it comes to government e-services. Most people in the rural counties prefer basic handsets with batteries that last longer compared to smartphones with shorter battery lives; and since most simple phones do not connect to the Internet, the result is fewer people with Internet access.
Additionally, gender power dynamics are another obstacle to Internet access in rural areas -with many rural women not participating at the household level. And remote areas in some counties still do not have the appropriate infrastructure for all residents to have access to internet services – which might hamper any e-government initiatives that are planned.HEALTH
SECTOR
- Doctor:population ratio
- Health facility numbers in the County
- Proportion of deliveries conducted by skilled birth attendants
- Proportion of children under the age of 1 fully immunized
- Proportion of general population testing positive for malaria
- % of villages declared Open Defecation Free
- Number of environment & public health workers
- No of TB cases identified and put on treatment
- Proportion of pregnant women attending 4th ANC visit
- Proportion of women of reproductive age accessing family planning services
- HIV prevalence rate
- Percentage of children under 5 that are underweight
Data Summary
No Data Found
No Data Found
Figure: Summary of Health Sector Results.
Most of the responses from the health sector fall within the final two stages of the model.
Results
Most of the indicators on the questionnaire are included in the District Health Information System (DHIS) or Health Management Information Systems (HMIS) which are databases that the national government uses to collate health data from different health facilities across the country.
Data practises in health are boosted by the efforts of the national ministry and partners when it comes to health; to collect data across the country and make it available to authorised users on an accessible platform (KHIS). There is an existing universal system for monthly data collection and reporting with regular validation and auditing. These structures and investments reflect on the scores across the board for the health sector to mostly fall within the flowering and fruitful stages of the model for both quality/availability as well as causality. Moreover, please note that three counties (Nairobi, West Pokot and Mandera) results are not reflected in these results as it was not possible to collect data in these counties by the time of reporting.
Quality and availability
No Data Found
Figure: Data Quality and Availability Scores – Health.
The health sector scores highly in data collection and reporting. However, there is room for improvement in scores across the board with a large number of responses in the seedling and flowering stages.
Causality
No Data Found
Figure: Causality scores – Health.
The health sector scored highly on incentives & accountability, and coordination & governance. Scores in the non-government system category are lower than for any other category under health.
AGRICULTURE
SECTOR
Similar to the Department of Health, and in line with Provisions of the 4th Schedule
of the Constitution of Kenya 2010, County Departments of Agriculture, Livestock
and Fisheries are responsible for crop and animal husbandry, livestock sale yards,
county abattoirs, plant and animal disease control, and fisheries32.
The following indicators were included in the quality and availability assessment for
the agriculture sector:
1. Tonnes of Maize Produced annually
2. Percentage of population receiving food aid
3. Proportion of animals vaccinated
4. No of annual trainings for farmers
5. Number of active farmer associations
6. Hectares of arable land under crop production
7. Tonnes of fish produced
8. No. of forests conserved, managed and protected
9. Ha of crops under irrigation
10. Number of beneficiaries accessing farm inputs (tools, seeds, fertilizers,
pesticides)
Data Summary
No Data Found
No Data Found
Figure: Summary of Agriculture Sector Results.
A large proportion of results fall within the final two stages of the model in both sections. Many responses under data quality & availability fall under the first stage of the model.
Results
Quality and availability
No Data Found
Figure: Data Quality and Availability Scores – Agriculture.
A large number of scores in this section are in the seedling stage of the model. However, a good proportion of responses still fall under the flowering stage which signals growth.
Causality
No Data Found
Figure: Causality scores – Agriculture.
The agriculture sector scores highly on mandate, incentives & accountability, and coordination & governance. Scores are more evenly distributed across the stages of maturity in the resourcing and non- government ecosystem categories.
EDUCATION
SECTOR
In Kenya, the government’s contextualization of education and training sector contains the following levels in terms of structure:
- Early Childhood Development and Pre-school Education
- Primary Education
- Secondary Education
- University Education
- Technical and Vocational Education and Training (TVET)
- Teacher Education and Training
- Non-formal Education and Adult Education
- Special Education
Similar to the Department of Health, and in line with Provisions of the 4th Schedule of the Constitution of Kenya 2010, the education department at the county level is responsible for Early Childhood and Development Education (ECDE) and Technical and Vocational Education and Training (TVET)40.
The following indicators were included in the quality and availability assessment for the education sector:
- ECDE enrolment rate
- ECDE teacher/Pupil ratio
- Rate of ECDE student transition to primary school
- Number of ECDE classrooms constructed and equipped in the last financial year
- Number of ECDE schools with a feeding programme
- Amount spent per ECDE student
- ECDE learners with special needs(%)
- TVET enrolment rate
- TVET instructor:trainee ratio
- TVET course completion rate
- Number of vocational training centres equipped with modern tools and equipment
- Proportion of TVET centres with access to internet connectivity
Data Summary
No Data Found
No Data Found
Figure: Summary of Education Sector Results.
There is a high proportion of responses in the flowering and fruitful stages of the model, but still a high number of results fall within the initial seedling stage.
Data management in the education sector is led by the national government through the National Education Management Information System (NEMIS). NEMIS is a tool that automates the efficient management of basic education in Kenya through collecting data and information from education institutions; processing and reporting the status of designed indicators; and providing the sector a solid ground for effective management to ensure that every learner counts. For example, the government has used the system for Form One admissions and in the provision of the Medical Insurance Cover for secondary school students. However, data collected at the institution level is mostly in physical records that are later uploaded to the database. Logistical hurdles such as connectivity issues and lack of trained staff are some of the barriers to schools accessing the system directly.
In this study, a larger proportion of responses fall in the first stage of the model, specifically in the causality section. However, due to the reliance on the national government for funding, the county education departments must collect and report data on students, instructors and resources regularly to avoid related penalties. Schools are also encouraged to record data in the NEMIS platform for each student for disbursement of per capita resources. This improves the scores for data quality and availability for the department.
Quality and availability
No Data Found
Figure: Data Quality and Availability Scores – Education.
The majority of cores are distributed between the initial seedling stage and the last two stages of the model. The scores are higher for data quality and reporting than other categories.
The government of Kenya is committed to providing education to all its citizens. When it comes to data; however, the number of school-age children who do not have access to education services remains high – especially among children with disabilities – more than those who do not have disabilities.
Education data is collected daily at the school level and reported to the sub county offices on a monthly basis – this data is vital in informing important decision making such as learner capitation grants43 as well as issues such as learner and teacher absenteeism. Additionally, in most of the counties under study, most children with special needs are enrolled in separate schools/classes.
Data on learners with special needs was not readily available. At the national level, we have the Kenya National Special Needs Education Survey – first unveiled in July 2016; but this has not been regularly conducted by the Ministry of Education.
Causality
No Data Found
Figure: Causality scores – Education.
The majority of the scores in this section fall within the first and last stages of the model.
Right to Information
The constitution of Kenya has an overarching legislation on the right of citizens to access information and this is largely acknowledged and upheld in county governments. In 2016 Kenya passed the Access to Information Act, 2016 in fulfilment of its obligations under the constitution Article 10, Article 33 and 35. The Commission on Administrative Justice (CAJ), the oversight mechanism under the Access to Information law, has also not filed annual reports to the National Assembly as required by law (during the period from 2016). Consequently, there is no report yet to enable an assessment on the state of access to information in Kenya44. In addition, Kenya is one of the 78 national signatories to the Open Government Partnership (OGP) and has been since 2011. At the time of writing, the country is implementing the Fourth National Action Plan with clear commitments around beneficial ownership and open contracting.
Data collection & storage
Feedback
Prioritisation
Data quality and availability was found to be of higher priority for departmental managers than the political class. This has bolstered claims that there are tendencies to prioritise programs based on politics as opposed to data and evidence where there are competing interests.
On one hand, departmental managers are held accountable by local and national government on their progress and use of funds, hence they recognise the importance of collecting and reporting accurate data regularly. On the other hand, there seems to be a need for further sensitization and capacity building on how data can be shared and used by elected officials so that the case for data management can be made and data management and governance are prioritised during county budgeting processes. This is depicted in the figure below
Resourcing
Most departments do not have a dedicated funding stream for staff and resources linked to data management. In Figure 21 below, the agriculture and education departments have a higher proportion of their budget dedicated to data management as there are higher numbers of officers collecting data in physical forms and/or templates on the ground. Data is integral to the operations of the governance sector as budgeting and planning activities involve data analysis and most of these exercises are carried out by the officials in charge of planning and monitoring and evaluation under this sector.
More data staff in the governance and health departments receive training specific to data management according to Figure 22 below. This is likely due to the technical requirements of the national databases; sadly the expertise to mine and analyse the data is not thorough in most cases. This may also be linked to the minimal interaction with the database during data collection in the education and agriculture sectors, since the majority of the exercise involves manual input into templates.